Running the demo
The demo is about getting real-time sentiment analysis done over recent temporal windows (e.g last 5 minutes) for tweets about a certain word. The focus is not on the quality of the sentiment analysis per se, as it's not the goal of the project. A model from NLTK ("Vader") is used.
To run the demo these steps are needed:
- Deploy a Kafka/Hadoop/Spark infrastructure.
- Create a Kafka topic for incoming data and another one for the final results of the sentiment analysis.
- Activate Twitter producer to generate the data.
- Submit the Spark streaming job.
- Optionally launch dashboard to view results in a graphical representation.
- Submit the Spark ingestion into HDFS job.
- Launch PySpark interactive shell to do something with the ingested data.
Each point is described in the following sections.
Infrastructure deployment
Refer to previous chapter and the following sections, which describe related details specific to this demo.
Naming assumptions
As seen in Hadoop deployment, "master" Hadoop node is assumed to have container name and hostname nn1.
The components of this demo also assume that at least a Kafka broker has kafka1 as container name/hostname.
Cluster deployment
Demo has been tested on AWS using 9 t2.medium instances:
- 1 Kafka broker
- 1 Hadoop "master" node
- 6 Hadoop "slave" nodes
- 1 Spark node
Yarn is already configured to have 3 queues: one (for streaming job) using up to 50% of resources, and the other 25% each.
Local deployment
Given the resource requirements, a local deployment of the entire demo is unrecommended for average PC. Refer to Hadoop configuration section to switch to a single Yarn queue using all resources. At that point run just one of the jobs (streaming, ingestion, interactive shell) at a time. A single Kafka broker and 3 Hadoop nodes should suffice.
Creating Kafka topics
Two topics are needed: one for handling the incoming tweets, and another to handle the results of the sentiment analysis streaming process.
One node with one Kafka broker is sufficient to run the demo. It's suggested to split the topics into multiple "partitions" as shown here, this allows parallel data consumption from Spark workers (see Kafka and Spark docs in case).
Naming
The name of (at least one) Kafka container is assumed to be kafka1 by demo components.
Create the two topics:
kafka-topics.sh --bootstrap-server localhost:9093 --replication-factor 1 --partitions 6 --create --topic tweets
kafka-topics.sh --bootstrap-server localhost:9093 --replication-factor 1 --partitions 6 --create --topic sentiment_scores
Activating Twitter source
This is the component that fetches tweets about a particular word and sends them to a Kafka topic. It requires developer API credentials from Twitter (registration is needed).
It's simply a Python3 script with a couple of module dependencies.
A Docker image can be found at carmineds/twitter_producer.
To build the image (not needed), follow the image build section.
It can be deployed on an ad-hoc node, or in an existing one (e.g same machine as Spark or an Hadoop "slave")
Run the container with (choose the appropriate network):
sudo docker run -it --net swarmnet carmineds/twitter_producer
Once the container is running, insert credentials in configuration file keys.ini (nano editor can be used for this).
Choose a word with at least a bit of popularity on Twitter, e.g. Trump. To see if the Twitter setup works try:
python3 twitter_printer.py trump
Tweets should be printed on console. Exit with Ctrl-C.
Finally run:
python3 twitter_producer.py kafka1:9093 tweets trump
Tweets are sent to the tweets topic on broker kafka1:9093
To see if it works try (on a Kafka broker):
kafka-console-consumer.sh --bootstrap-server localhost:9093 --topic tweets
Running streaming job
This is the core part of the demo. A Spark (Structured Streaming) job that reads streaming (tweets) data from a Kafka topic and produces average sentiment analysis scores over temporal windows, serving it all on another Kafka topic.
Frequency and length of temporal windows can be changed in the script, but an increase in demand (higher frequency and/or larger time windows) could ramp up the resources needed. Also different quantities of data affect this. For more see memory configuration appendix, Structured Streaming section and Spark documentation.
(Cluster deploy only) Copy files to Spark node, e.g. with scp:
#"spark_node" IP configured in /etc/hosts
scp -r spark_scripts/ ubuntu@spark_node:
Copy files from host to the container:
sudo docker cp spark_scripts/ spark:SCRIPTS
Access to the container and the just created directory. Submit the streaming Spark job with:
spark-submit --master yarn --deploy-mode cluster --packages org.apache.spark:spark-sql-kafka-0-10_2.12:3.0.1 --py-files dep.zip twitter_nltk_append.py
The zip file contains Python dependencies (NLTK)1.
Textual results can be seen on the sentiment_scores Kafka topic. On a Kafka container run:
kafka-console-consumer.sh --bootstrap-server localhost:9093 --topic sentiment_scores
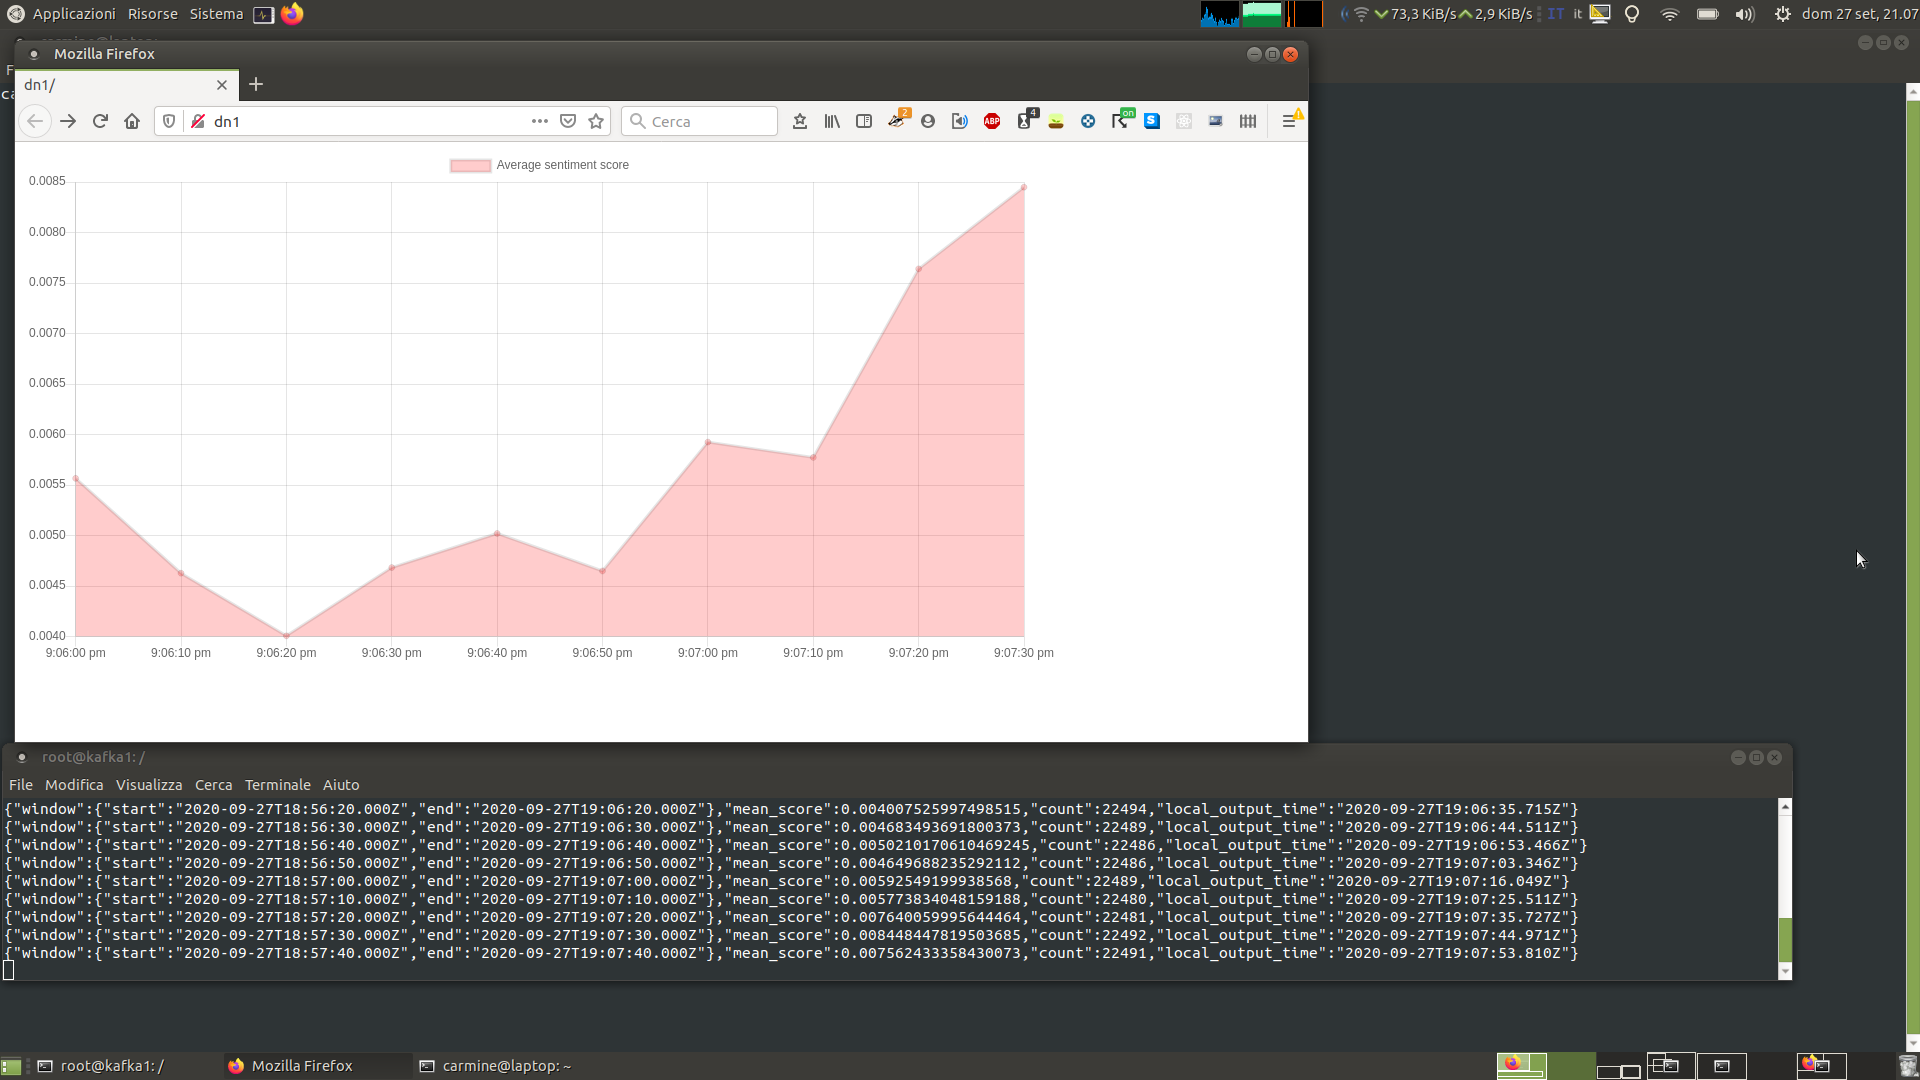
Data visualization (dashboard)
To view the results in a graphical representation, this component can be used.
A Docker image can be found at carmineds/flask_chart.
To build the image (not needed), follow the image build section.
It can be deployed on an ad-hoc node, or on an existing one (e.g same machine as Spark or an Hadoop "slave").
Run:
sudo docker run -it --name flask_chart -p 80:5000 --net swarmnet -d carmineds/flask_chart
The graph can be accessed by browser on port 80. In a cluster situation, be sure to open port 80/tcp towards the client public IP (for AWS see the port forwarding section).
Ingesting data to HDFS
The script for this is in the same folder as the script for the streaming job on the Spark instance.
To submit this job the other spark-submit can be closed locally with Ctrl-C (it continues to run).
As an alternative, another bash instance can be opened.
Run:
spark-submit --master yarn --deploy-mode cluster --queue second --packages org.apache.spark:spark-sql-kafka-0-10_2.12:3.0.1 kafka_hdfs_sink.py
Note that a different queue with respect to the one used by the streaming job is used.
Size of the ingested data can be seen at any moment executing this in the Hadoop "master" container nn1:
hdfs dfs -du -h -s /kafka_data.parquet
Interactive shell (batch job on ingested data)
Once some data is ingested, using a third Yarn queue, another job can be submitted to do something on it.
Open an interactive PySpark shell (on Spark container) with:
pyspark --master yarn --queue third
Once it's initialized, to count the number of ingested tweets run:
df = spark.read.parquet('/kafka_data.parquet')
df.count()
Here is a sligthly more advanced script to try:
# Top 20 words (including common ones) in ingested tweets
from pyspark.sql.types import *
from pyspark.sql.functions import *


def ascii_ignore(x):
    return x.encode('ascii', 'ignore').decode('ascii')

ascii_udf = udf(ascii_ignore)

tweets = spark.read.parquet('/kafka_data.parquet')
stweets = tweets.select(tweets.value.cast(StringType()))
words = stweets.select(explode(split(stweets.value, '\s+')).alias('word'))
filtered_words = words.select(ascii_udf(words.word).alias('word'))

filtered_words.groupBy(filtered_words.word).count().orderBy(col("count"), ascending=False).limit(20).show()
Appendix: Spark Structured Streaming
Structured Streaming is the new Spark standard for streaming data. Based on DataFrame/Dataset API (as most Spark layers now in version 3), it allows to handle the incoming stream of data as it was a fixed size Dataframe, so the difference between writing a batch job and a streaming job has been reduced to a minimum.
Under the hood it works with micro-batches, with a delay as small as ~100ms (but more recent Continous Processing mode allows much smaller delays). It offers exactly-once semantics, with checkpointing (to resume processing in case of interruptions) and handling of late data (watermarking).
The processing state is handled automatically, so, working with aggregations, just the useful data is retained over time.
There are 3 ways to "sink" the data:
- Complete mode: At each trigger/micro-batch all the output aggregations since the beginning of the job are written.
- Append mode: Results for a particular window are written once, when it's finished (and the late data wait time has passed).
- Update mode: At each trigger, just time window aggregations for which new data has appeared are written to output sink.
For more refer to the official Spark documentation.
Appendix: Spark memory configuration
To increase memory used by Spark executors (running in Yarn containers), driver-memory and executor-memory options can be used.
To dedicate the whole node assigned resources to the driver, in case of a Yarn configuration for which maximum memory for containers is 3072m, add the option in this way:
spark-submit ... --driver-memory 2688m ...
E.g. for demo streaming job:
spark-submit --master yarn --deploy-mode cluster --queue second --packages org.apache.spark:spark-sql-kafka-0-10_2.12:3.0.1 --driver-memory 2688m kafka_hdfs_sink.py
2688m is calculated as 3072m (maximum capacity configured for Yarn NodeManagers) minus 384m (fixed Spark memory overhead). For more refer to Spark and Hadoop docs.
-
https://stackoverflow.com/a/39777410 ↩